Author Archives: Alyssa Fu Ward

About Alyssa Fu Ward

Alyssa Fu Ward did her graduate work at Stanford in Social Psychology, with a focus on culture, motivation, identity, and well-being. After earning a PhD, she worked as a data scientist and data science manager in industry. She first worked for an education startup where she helped academics like herself transition to industry. Since then, she has worked as a data scientist at Twitter and other tech companies. Alyssa lives with her two daughters and loving husband who supports her many wild ideas. Across all these experiences, Alyssa aims to learn and is always looking for opportunities to stretch her skills, whether it’s in data science, social science, motherhood, leadership, or creative endeavors!

Mixed Models and R

Check out this webpage for a thorough overview of running mixed models in R. I wanted to pull out a few pieces of information from this article that I found useful. (If you aren’t familiar with mixed models, the following may not be too meaningful for you.)

Nested vs. Crossed Random Effects

“Before you proceed, you will also want to think about the structure of your random effects. Are your random effects nested or crossed? In the case of my study, the random effects are nested, because each observer recorded a certain number of trials, and no two observers recorded the same trial, so here Test.ID is nested within Observer. But say I had collected wasps that clustered into five different genetic lineages. The ‘genetics’ random effect would have nothing to do with observer or arena; it would be orthogonal to these other two random effects. Therefore this random effect would be crossed to the others.”

Identifying the Probability Distribution that Fits the Data

The author of the page plotted the data along various types of distributions (e.g., binomial, Poisson, gamma, log-normal).

“The y axis represents the observations and the x axis represents the quantiles modeled by the distribution. The solid red line represents a perfect distribution fit and the dashed red lines are the confidence intervals of the perfect distribution fit. You want to pick the distribution for which the largest number of observations falls between the dashed lines. In this case, that’s the lognormal distribution, in which only one observation falls outside the dashed lines. Now, armed with the knowledge of which probability distribution fits best, I can try fitting a model.”

Failure to Converge

I often encountered the error “failure to converge” when running mixed models. This article describes what now seems like an obvious way to deal with the failure to converge – systematically drop effects from the model and compare the performance. I am appreciative of how much I’ve learned and grown in my statistics knowledge because of my exposure to data science over the last year and a half.

“There is one complication you might face when fitting a linear mixed model. R may throw you a “failure to converge” error, which usually is phrased “iteration limit reached without convergence.” That means your model has too many factors and not a big enough sample size, and cannot be fit. Unfortunately, I don’t have any data that actually fail to converge on a model that I can show you, but let’s pretend that last model didn’t converge. What you should then do is drop fixed effects and random effects from the model and compare to see which fits the best. Drop fixed effects and random effects one at a time. Hold the fixed effects constant and drop random effects one at a time and find what works best. Then hold random effects constant and drop fixed effects one at a time. Here I have only one random effect, but I’ll show you by example with fixed effects.”

———

This article goes through more of the “math” of mixed models. I’m putting it here for now so I can look through it in more detail later.
Iteration vs. recursion

A few days ago, I showed a fellow burgeoning data scientist my code. What he saw made him gasp in horror. “You use for loops?! You shouldn’t use for loops…,” he said. I was a little surprised. Learning for loops was one of those breakthroughs in coding for me. But I could see what he was saying. I’ve been looking at a lot of Python code recently, and very rarely do I see for loops. I see a lot of defined functions, though. It’s overwhelming to see other programmers doing so much of something that I don’t yet do.

So I took to the Googles to investigate what’s the deal with for loops.

My first search yielded results on how to avoid for loops in R. This first result was interesting: it details how to use ifelse() statements that work on vectors instead of nested if-statements. But I already knew about this statement and it doesn’t always work for what I need to do.

But that result linked to another article that described the apply() functions and how to use it to apply a function across vectors. I’ve used this function once or twice (without really understanding what it did). But what shocked me was that I’ve used its sister function, tapply(), as one of my base functions when taking summary statistics, but I had never realized this is what it was doing. Mind blown. So that’s something I can use in the future.

But I still didn’t get a comfortable answer to why shouldn’t I use for loops and when should I use functions (turns out recursive functions) instead?

Then I read this response that someone gave to this similar question that I am pursuing in which they basically say “Recursive functions are perfect for tree structures. Loops are perfect for iterations and sequences.” I had to look up tree structures, which are basically nested structures with different branches of information. I’ve definitely used for loops and if statements to iterate through a tree structure.

I then started trying to really understand what iterations and sequences are to define use cases for for loops versus recursive functions. I found this useful article, which I liked for how simply it explains the ideas. Recursion relies on a base case (on terminating on a base case), while iteration terminates when the loop-continuation condition fails. It’s a little confusing, because this says that recursion is memory-intensive (which I remember now from a brief little experiment I did with recursive functions a few months ago), but something else I read said using functions instead of for loops reduces memory. I suppose it may depend on the type of function??

Hm, now I’m starting to wonder if iteration does not necessarily mean for loop, since you must be able to have iterative functions?

I guess I’m still confused about when to write functions versus write for loops and if that’s even a reasonable comparison to make.

Fun with Fourier Transforms

I’ve started reading Hacker News, and this PDF on Fourier Transforms came across the feed. It’s a really interesting introduction to Fourier Transforms with some added information on how to create a signal processing device on the side.

Back in the day, I had once taken a speech perception class where we analyzed speech frequencies. For all I know I learned about Fourier Transforms then, but I don’t remember now. Either way, reading about sine waves have never made me so excited!

Linear Mixed Effects Analyses Tutorial (in R)

One of my datasets requires mixed models linear regression analyses, so I was reading up on exactly how the analyses are done and what they mean. Found this useful-looking tutorial that walks through several examples of the mixed effects, as well as how to do it in R.

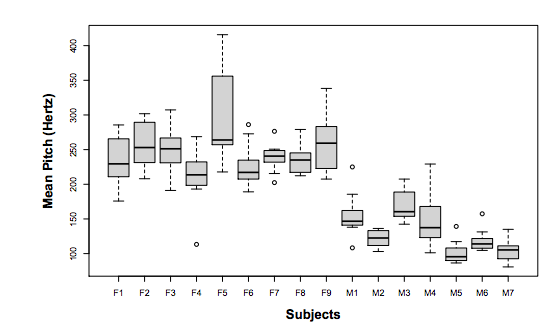
Here’s a graph of individual subjects, grouped by gender, and the distribution of their voice pitch.

Pitch of male and female voices

Pitch of male and female voices

To take into account the individual variation in each subject’s voice pitch, run pitch ~ politeness + sex + (1 | subject) + error, where (1 | subject) indicates the assumption that the intercept is different for each subject.

PS. I love box plots!

Creating HTML5 Slides in R Markdown

OMG. My mind is literally exploding right now. This is starting to become my default state. (I like it.)

I am searching how to change the font size in the HTML output file from an R Markdown, knit to html, when I came across this page by Yihui (a name that is becoming extremely familiar as I spend more and more time on Stackflow).

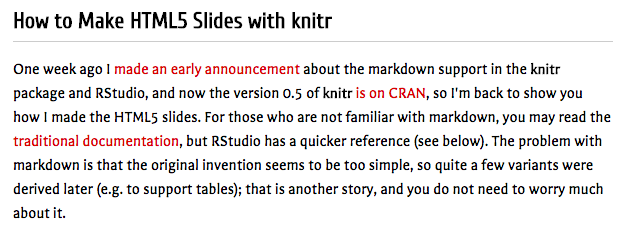
How to Make HTML5 Slides in R Markdown

How to Make HTML5 Slides in R Markdown

He basically walks through how to create HTML5 slides in R Markdown. They are BEAUTIFUL. I am so floored.

Here is a link to the slides. Just use your left and right arrow keys to navigate through them.

HTML5 slides through R Markdown

HTML5 slides through R Markdown

I would love love love to be able to learn how to do this, but I think for my kind of presentations, it wouldn’t make sense to make them in HTML5. It’s a shame. It would be so mind-blowingly cool!!

Now to return to my current problem… how to change this pesky font size…

Resizing plots in R Markdown

I made a lot of progress on one of my datasets today. It’s a 2 x 2 x 2 study, so it requires a fair amount of thinking in what the best way is to plot the data.

Lately I have been writing up my code in an R script, then when I’m happy with it, I plug it into R Markdown so I can see all the graphs at once.

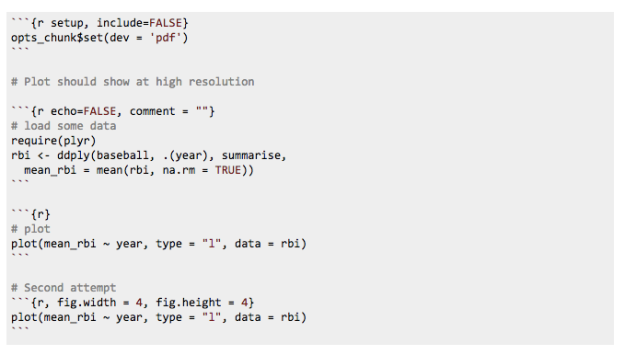
When I plotted my 3-way interaction graphs, the group labels on the x-axis squished together because the default plot size was too small. So I looked up how to change the plot size in R Markdown and found this useful stackflow response.

Plot size in R Markdown

Plot size in R Markdown

So I tried it and voila! My plots look beautiful in R Markdown.

Plots in R Markdown

Plots in R Markdown

K-Means Clustering

I want to use k-means clustering for one of my studies, so in this post, I gather useful-looking links to learn how to do it!

EDIT: I made pretty good progress on my k-means clustering! Here’s a little preview to give you an idea of what I found:

kmeans clustering

kmeans clustering

Useful Information on K-Means Clustering

https://stat.ethz.ch/R-manual/R-devel/library/stats/html/kmeans.html
R documentation for kmeans

kmeans {stats}

kmeans {stats}

http://www.r-bloggers.com/k-means-clustering-is-not-a-free-lunch/
When k-means may not work but how to work around it

K-means clustering is not a free lunch

K-means clustering is not a free lunch

http://www.rdatamining.com/examples/kmeans-clustering
Simple, easy example to follow for how to use k-means clustering

k-means Clustering

k-means Clustering

http://www.r-statistics.com/2013/08/k-means-clustering-from-r-in-action/
How to determine number of clusters

K-means Clustering

K-means Clustering

http://www.statmethods.net/advstats/cluster.html
Simple reference for how to k-means cluster

Cluster Analysis

Cluster Analysis

https://rstudio-pubs-static.s3.amazonaws.com/33876_1d7794d9a86647ca90c4f182df93f0e8.html
Walks through several examples

Cluster Analysis in R

Cluster Analysis in R

http://www.improvedoutcomes.com/docs/WebSiteDocs/Clustering/K-Means_Clustering_Overview.htm
To the point overview of clustering: Pros and cons

Overview of Clustering

Overview of Clustering

http://www.norusis.com/pdf/SPC_v13.pdf
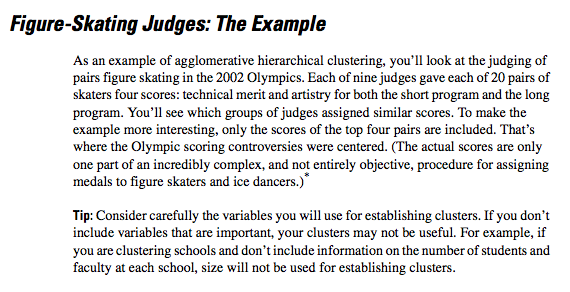
Chapter on kmeans clustering – Useful discussion on determining variables

Cluster Analysis Chapter

Cluster Analysis Chapter

http://stats.stackexchange.com/questions/31083/how-to-produce-a-pretty-plot-of-the-results-of-k-means-cluster-analysis
Plotting pairwise scatterplots of clusters

Pairwise scatter plots of clusters

Pairwise scatter plots of clusters

Merging Data in R and the Power of a List

Okay, last post of the day, but I wanted to document a really cool breakthrough I made today in my understanding of lists in R.

In another one of my datasets, I assessed people’s recollection of situations in which their parents told them what to do. I collected data last quarter and this quarter, so I have two datasets for the same study (I like to start with a fresh study/data collection by quarter because sometimes it’s good to account for which quarter you ran the study, and it’s easier for me to keep track of the progress of the study when I focus on one quarter at a time).

First, I set my working directory, then I created variables for the names of each of my files.

setwd() and data file name

setwd() and data file name

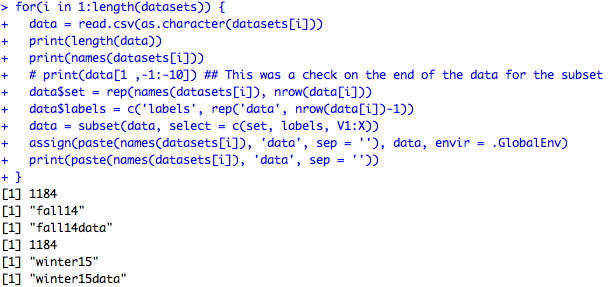
Then I created a for loop to read each dataset into R and check their length (number of columns).

for loop - Read in data and print length

for loop – Read in data and print length

Next I wanted to name each dataset based on their variable name. As you can see in the example above, when I call “i”, it doesn’t call “fall14” or “winter15”; it calls the element that is stored in that variable.

So I played around with some ways to call the variable name, but what I eventually discovered from this link is that I can use the list function to name my variables within the list, and that will allow me to be able to call the name from the list (seems similar to a dictionary, eh?).

for loop - names(datasets())

for loop – names(datasets())

And in fact, I can set up my list to name the variable the name I had assigned it previously, list(fall14 = fall14, winter15 = winter15), and obtain the same result. I like the idea of doing this because I would rather define my variables outside of the list of variables where it’s easier to track the variable names (and looks cleaner). The funny thing is, I’ve used this exact call in the past when creating a new dataframe for a different project, but at the time I didn’t realize what I was doing. I love learning new things (or relearning old things/realizing how to understand things I thought I knew?)!

list(fall14 = fall14, winter15 = winter15)

list(fall14 = fall14, winter15 = winter15)

After that it was easy enough to merge the data. I won’t go over the process in detail here, but I provide my full script below (I’m starting to feel like this could be a good time to start making use of that GitHub thing). Basically I create a new variable to label which dataset is which and a variable to distinguish between rows in the data frame that are data and the first row in the data frame being a second variable row that is exported in Qualtrics. I rearrange the order of the data so my new variables are the first columns of the data frame. And then finally, I assign the new data frame a name based on the name in the list (“fall14” and “winter15”), but I added “data” after it so that it doesn’t overwrite the original variable.

Full for loop - Creating mergeable datasets

Full for loop – Creating mergeable datasets

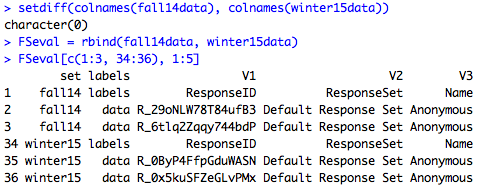
I checked to make sure there was no difference in their column names, just in case, then merged them together and checked what the data looked like.

setdiff for discrepancy in variable names and rbind to merge rows

setdiff for discrepancy in variable names and rbind to merge rows

Whew! And that’s just the first step! After this I have to clean the data, and then the real fun happens: analyzing the data for trends and testing hypotheses. Who’s ready for a good time?

Part 3 Caught in a Web Scraping Maze: httr and rvest in R

At about this point, I started to think, if all these people are creating their own web scrapers, why can’t I? How hard can it be to pull some links off a page anyway….

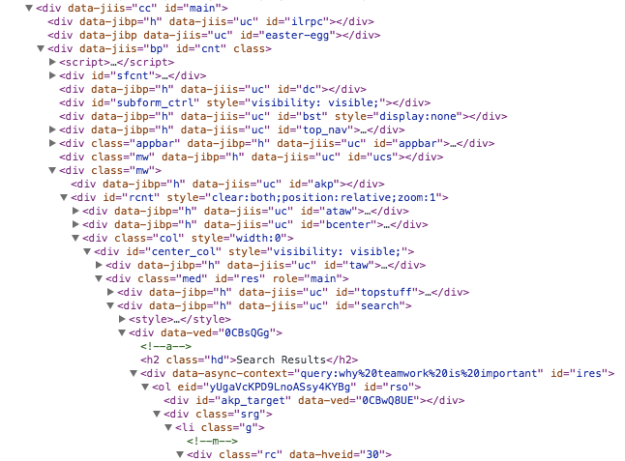
So I went back to Google and inspected the elements on the page to see if I could identify the URLs of the search results. Using the Inspect Element tool in Chrome, I found the tags tied to the URLs of the search results.

Inspect element

Inspect element

They are deeply embedded in div within div within div within.. you get the point.

Alright, it’s getting late so I’m going to try and cut to the chase.

Since I knew that scraping Google search results was different from scraping html content (with rvest), I started by Googling “scrape google results R”, and this result about httr came up. I installed the httr package, then ran the example script. Cue drumroll!

httr script

httr script

…aaaand error. xpathSApply does not exist! Some searching revealed that it’s a function in the XML package, and since I don’t work much with XML data, this was a good chance to get my feet wet with it.

So I installed the XML package and tried again. Any luck this time?

httr script (with XML)

httr script (with XML)

Mmmm… sort of? At least it pulled a URL, but not really the right one. I tried running their exact script, but it still didn’t yield usable URLs. (I just realized that in my script, I didn’t put “+” between the words of my search. But when I did it just now, I got the same results as below).

httr reproduction

httr reproduction

Okay, so then I turned to rvest to see where it could get me. I tried a number of things like referencing the HTML nodes, then CSS ones, and even XML ones. Here are the links I used to guide my quest out of the web scraping maze: rvest documentation, web scraping with R tutorial (CSS), Stackflow diving into nodes, and even a really handy-looking site (from Stanford might I add) for once the URLs are gathered (pin that for later). When I dove in, this is what I found.

First, pulling the html document of the Google Search Results revealed this:

html(google search results)

html(google search results)

I could tell there were some differences in the output and in what I saw through the Inspect Elements, but at first glance, this output looked fairly reasonable, so I moved forward.

As a first test, I looked to see what I would get if I pulled the html text out of the <a> tags.

html_nodes("a") %>% html_text()

html_nodes(“a”) %>% html_text()

Hm, interesting. So it seems the accessible URL links are ones that are standard on Google search pages.

Then I tried a bunch of different calls to see what kind of tags html_nodes take (can it take a class name? …seems the answer is no.)

character(0)

character(0)

Nada. Alright let’s try a different approach. I tested one of the examples described in the rvest documentation, pulling data from the A-Team site on boxofficemojo.

A-Team html_nodes("center")

A-Team html_nodes(“center”)

A-Team html_nodes("center") %>% html_nodes("td")

A-Team html_nodes(“center”) %>% html_nodes(“td”)

Woo hoo! I love it when a plan comes togther …at least in the case, and at least it looks like the script works and the source of my woes is coming from the Google Search Results in particular.

I tried calling the divs from the Google Search Results page, but the results were odd. Some of the divs at the first level were present in the output, but some that were in the output I couldn’t find through Inspect Elements.

teamwork %>% html_nodes("div")

teamwork %>% html_nodes(“div”)

And then when I looked for the id of the first level div containing (eventually) the div containing the URLs, it wasn’t in the output. (Below is the first level div containing the URLs.)

Inspect element: First level divs

Inspect element: First level divs

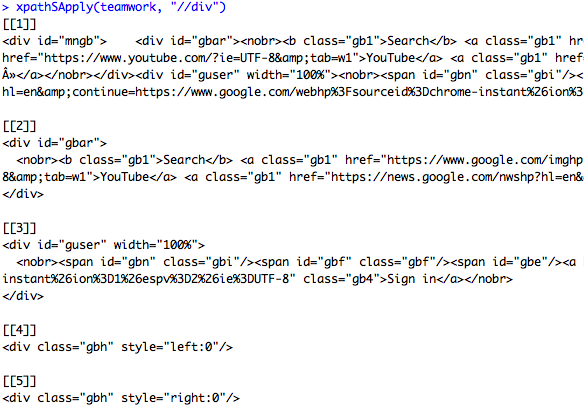
I tried using XML-specific calls, but encountered similar results.

xpathSApply(teamwork, "//div")

xpathSApply(teamwork, “//div”)

Even when I drilled down those divs, it went down… the first one? I’m not sure where it went down.

xpathSApply(teamwork, "//div//div//div")

xpathSApply(teamwork, “//div//div//div”)

So I’m really not sure why I can’t drill down to the data I want, but it feels like something is blocking my way, that Google Search Results is doing something special to hide their key info on this page. But I have no idea.

I think what I’ll try next (another day) is to download the page source and scrape the plain text file. I should be able to at least do that. That means I’ll still have to go in and download the page source of about 10 pages of search results for my project. But maybe I could also write a Python script that can pull the page source for me? Most of the time the purpose of these scraping programs is to track daily or by the minute (or second!) changes in pages on the web. But for me, my goal is to take a snapshot of what discussions of teamwork look like in America and Korea, so capturing the data is just a one-time thing and that kind of solution could suit my purposes. But for now that’s future Alyssa’s problem!

Part 2 Caught in a Web Scraping Maze: xgoogle Python module

During my investigation for web scraping methods in Python, I came across this Stackflow discussion that used the Python module, xgoogle, to scrape Google search results while also building in a wait time between searches. It looked like a promising method, so I tried it out.

Unfortunately, as is the case with many young programmers, at every step I ran into trouble.

trouble

First, I tried to import the module into IPython. That was silly; I hadn’t installed it yet! So then I tried to install it using commands in the Terminal (similar to what I would do in R). But unlike R (it seems), Python has no way of knowing where to pull the installation files or what I’m asking it. So it kept telling me, “Sorry I have no idea what you’re trying to do.” Eventually I did manage to set it up (described later in this post), but first I have to share something very strange that happened.

In the process of trying to install xgoogle, I noticed something in my Terminal that horrified me. Instead of the Terminal reading my Home Directory as “Alyssa-Fus-Macbook-Air” it was reading as “jims-iphone”. What the!? Who in the world is this Jim, and what is his iPhone doing on my computer!?

Jim's iPhone infiltrating my laptop

Jim’s iPhone infiltrating my laptop

I’ll admit, I panicked. I’m very new to working in the Terminal and I was convinced that somehow I had been hacked. But like any calm and composed programmer, I swallowed my fear and turned to the one thing that could save my computer from inevitable doom: Google.

After starting with several vague and terrified search terms (“WHO IS INVADING MY COMPUTER AND HOW DO I STOP THEM?! …just kidding I didn’t search anything that histrionic), I finally whittled down my search to something specific: “terminal name different from user name”.

The links I found helped me to investigate the problem and in the end, solve it. First I looked into how far this “name change” went. Was I somehow accessing Jim’s iPhone or was this a superficial name change and I was still accessing my own computer and files? So I changed the directory to my Desktop, and I checked what was in it. (I suppose I could have just looked in the directory itself, but I wanted to see what would happen if I went “deeper” into “Jim’s iPhone”). This helped me confirm that though my laptop was taken over by the evil iPhone of Jim, at least everything seemed to be where it was supposed to be.

Jim can take my laptop's name, but he can't take my laptop's contents!

Jim can take my laptop’s name, but he can’t take my laptop’s contents!

So then I checked to see if my computer name was still the same, or if Jim had taken that too.

Sorry Jimmy Jim, you can take my name, but not my name name!

Sorry Jimmy Jim, you can take my name, but not my name name!

Okay, so I’m starting to calm down. Then I found this article discussing this problem, and I focused on the second response about computer sharing. I looked at my Sharing Preferences and was shocked to see Jim had infiltrated at this level.

Jim just wants to share

Jim just wants to share

Why, Jim, why?! What did I ever do to you…

So at this point I’m wondering, when I installed all those pandas and numpy modules and anaconda whatsits did I accidentally download something that changed my HostName to Jim? Or maybe since I’m always connecting to foreign networks (in cafes, in the library, in hotels), is that where I picked up a little friend named Jim?

This result suggests the latter explanation is most likely. “In short, the Mac will pick up a host name from the DHCP server. This does not affect your computer’s name as you have assigned it. This will only affect what you see at the command prompt.” Ah haaaa that’s plausible and no cause for alarm (I’m sure). (What’s the purpose of this though?)

And then this result gave a suggestion for how to change the HostName. I have read several cautionary tales of using “sudo” which makes changes directly to the OS (I think), but this seemed harmless enough. So I ran the command, and once I restarted my Terminal, everything was right as rain. Whew!

sudo scutil --set HostName Alyssa-Fus-Macbook-Air

sudo scutil –set HostName Alyssa-Fus-Macbook-Air

Right as rain

Right as rain

Alright! Now that that snafu has been fixed, let’s return to the real task at hand: installing xgoogle.

Eventually after several failed attempts, I found this Stackflow answer and used it to successfully install the module. I just had to download all the scripts from the xgoogle Github page, put the folder in my directory, change my directory to that folder, then run the script. And it worked beautifully!

Installing xgoogle

Installing xgoogle

Alright alright alright! Let’s put this puppy into action.

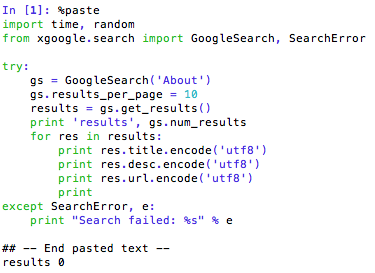
I ran the script straight (without the wait time) to see what I would get.

GoogleSearch results

GoogleSearch results

Unfortunately what I got were… 0 results. 0 results! How is that possible?

This response on Github suggested it was a bug and needed a patch available here as well as in the comments. …but I’ll admit, I had no idea how to apply the patch. I decided to run the code straight, because I figured this would replace the old function, and then I could rerun my code. But the patch code kept getting stuck.

When I copy-pasted from the comments (made by the creator of xgoogle himself), I got an Indented Block error:

Indented block error

Indented block error

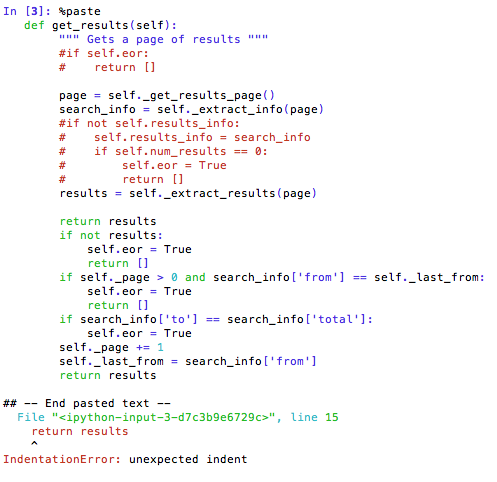
So then I tried the RAW Paste Data from the pastebin site linked above:

Surprise! Unexpected indent

Surprise! Unexpected indent

Another indent error. I tried pasting them into TextWrangler to double-check the indents and reran the code. This time, there was no error for the patch code (omg, maybe it’s working?!) — I held my breath and ran the GoogleSearch script again…. still 0 results. Bah. Dejection…

PS. I just checked my afp address and now it looks like a perfectly normal random set of numbers. Whew! Good-bye Jim’s iPhone! It was fun, but I’m happy you are no longer on my computer.